Preparing the Data (Step=2)
Relevant code
XDpiped.csh StatsandPrepareXD
Relevant options
None
What it does
All files are now “prepared” using the nsprepare task, called by
XDpiped.csh via StatsandPrepareXD.py. As described on the GNIRS XD DR
page, this finds the MDF (mask definition file) shift and flags saturated
pixels. The nighttime files (generally science target, standard star, flats,
and arcs) and daytime pinhole files are prepared separately because shifts in
the x position of the XD orders have been observed to occur between data taken
at different times (the prism turret is not perfectly reproducible), and
preparing the pinholes separately from the nighttime data allows a different
shift to be applied if necessary. If a shift occurs between nighttime files,
this will not be taken into account, and the data may not be reduced properly.
Currently, there are no safeguards to prevent this in XDGNIRS, so the user
should inspect the data before running the reduction and ensure that the orders
are in the same place in the x direction to within a few pixels in all data
taken during the night.
The prepared files are given the prefix “n” (e.g., cN20120305S0067) and
are saved in the INTERMEDIATE subdirectory. StatsandPrepare.py then uses
nsreduce to “cut” the data, putting each spectral order into a
separate file extension. The output files, which are stored in the
INTERMEDIATE subdirectory are given the prefix “r” (e.g.
rncN20120305S0067).
This module also measures and records some statistics on the input
images, recorded in the PRODUCTS/XDGNIRS_Log.txt file. The statistics
can be used to determine whether any images have unusually low or high
counts. For example, the first flatfield of a sequence can sometimes be
affected by the tertiary mirror not being properly positioned,
resulting in low counts in that flat. The code looks for flats that
deviate by \(>\)10% from the mean of all the flats and also
raises a warning if the mean of the flats differs substantially from the
expected value (although the “expected value” is just a rough guess at
what is acceptable). The results of these checks are summarised in the
PRODUCTS/Checks_and_Warnings.txt file.
What to look for
If no shifts exist between the input data files, this step should work without
problems. However, interested users may wish to display one or more of the cut
files for each type of data using the display or nxdisplay commands to ensure
that the correct region of the array has been placed into each extension. See
the GNIRS XD DR page for examples of good and bad cutting. All files are cut
at this stage. While this is not strictly necessary – the science target and
standard star observations are cut by nsreduce later in the reduction; see
Reducing the Science Target and Standard Star Data (Step=4), it does allow all of the cut data to be inspected in one go if
desired. Also, check the PRODUCTS/Checks_and_Warnings.txt file and, if warnings
are recorded, the statistics in the PRODUCTS/XDGNIRS_Log.txt file.
Things to most likely go wrong
This usually works OK. If it does not, there is probably something unusual about the input data.
Example: NGC 3031
Fig. 2 shows extension 2 (order 4) of an on-source galaxy file and a quartz halogen flat file after the orders have been cut into separate extensions. The slit and MDF match up well in both cases (the galaxy/flat signal has not been “chopped” or truncated), meaning that nsprepare found the correct shift of the MDF relative to the data.
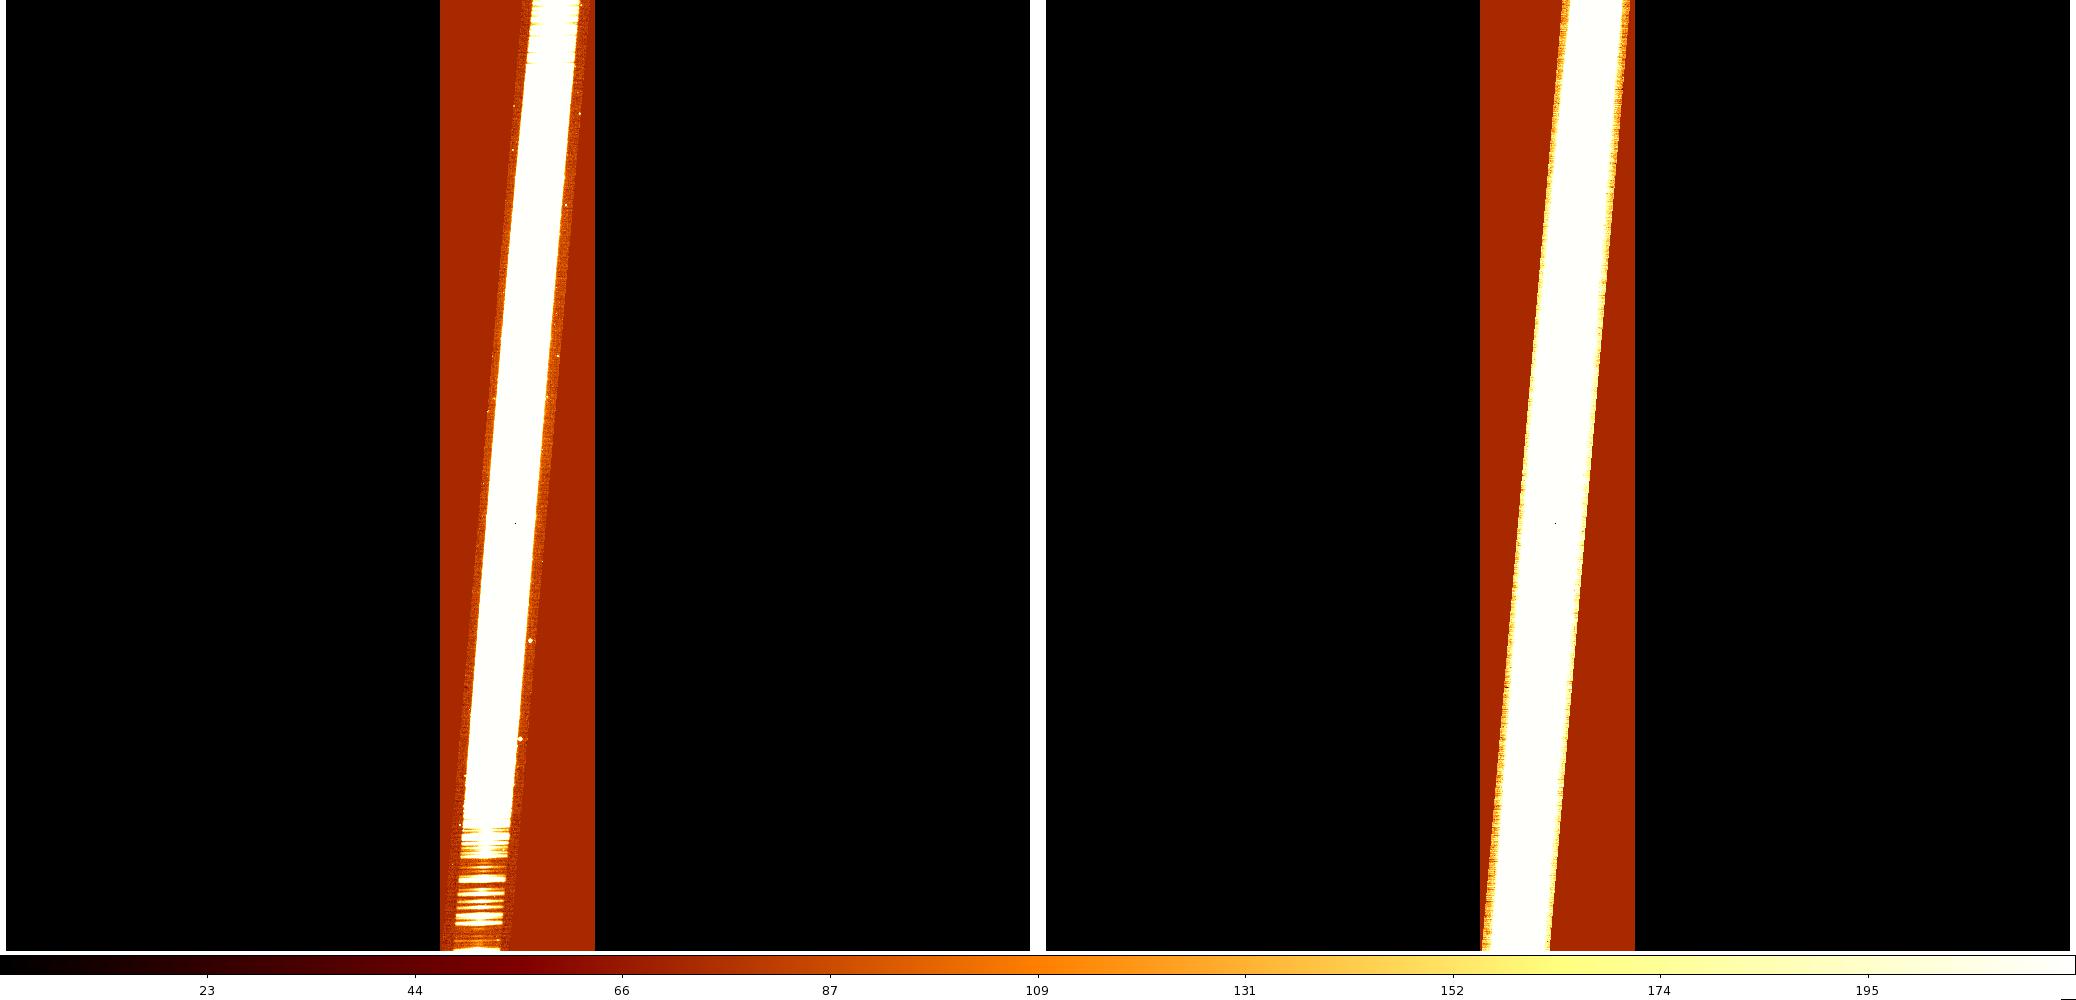
Fig. 2 Left: file rncN20120305S0067[sci,2]. This is extension 2/order 4 of an on-source galaxy spectrum after the orders have been “cut” into separate extensions by nsreduce. Right: rncN20120305S0074[sci,2], ext 2/order 4 of a quartz halogen flat file after the cutting. Display these files with z1=-20 and z2=20 to reproduce this figure.
The PRODUCTS/XDGNIRS_Log.txt file now contains the following information:
***CHECK: Counts in cleaned images differ by <10% from those in the raw data
#               IMAGE      NPIX      MEAN    STDDEV       MIN       MAX
   cN20120305S0074[1]   1046528     385.9     866.4     -371.     4719.
   cN20120305S0075[1]   1046528     390.8     877.4     -341.     7317.
   cN20120305S0076[1]   1046528     394.4     880.9     -351.    10439.
   cN20120305S0077[1]   1046528     393.1     882.8     -327.     8737.
   cN20120305S0078[1]   1046528     395.5     884.4     -341.     8292.
   cN20120305S0079[1]   1046528     394.1     885.3    -1263.     8546.
   cN20120305S0080[1]   1046528     394.6     886.2     -348.     8006.
   cN20120305S0081[1]   1046528     394.9      887.     -984.     8078.
   cN20120305S0082[1]   1046528     395.4     887.3     -375.     3968.
   cN20120305S0083[1]   1046528     395.3     887.9     -338.     8905.
   cN20120305S0068[1]   1046528     105.7     433.9     -293.     7987.
   cN20120305S0069[1]   1046528     179.7      717.     -323.     7816.
   cN20120305S0070[1]   1046528      185.     715.7     -278.     7696.
   cN20120305S0071[1]   1046528     179.1      713.     -287.     8195.
   cN20120305S0072[1]   1046528      183.     709.7     -300.     8229.
   cN20120305S0073[1]   1046528      178.     708.6     -298.     7730.
   cN20120305S0084[1]   1046528     4.901     93.81     -368.     4758.
   cN20120305S0085[1]   1046528     5.598     95.15     -372.     4894.
   cN20120305S0043[1]   1046528     18.72     104.3    -475.2     8366.
   cN20120305S0044[1]   1046528     19.89     107.9     -477.     8753.
   cN20120305S0045[1]   1046528     18.33     98.54    -433.1     8201.
   cN20120305S0046[1]   1046528     21.83     113.4    -416.6     9756.
   cN20120305S0047[1]   1046528     21.74     119.9    -432.2     8335.
   cN20120305S0048[1]   1046528     20.77     114.6     -429.     8948.
   cN20120305S0049[1]   1046528     21.79     116.9    -423.5     8378.
   cN20120305S0050[1]   1046528     21.49     118.7    -454.5     8554.
   cN20120305S0056[1]   1046528     29.46     128.1    -119.5     7824.
   cN20120305S0057[1]   1046528     5.136     96.65    -641.6     7714.
   cN20120305S0058[1]   1046528     5.288     106.4     -524.     7739.
   cN20120305S0059[1]   1046528     33.48     129.7    -110.6     7566.
   cN20120305S0060[1]   1046528     32.48     126.8    -611.8     7817.
   cN20120305S0061[1]   1046528     7.288     99.94    -582.5     7619.
   cN20120305S0062[1]   1046528     8.024     96.34    -595.7     8021.
   cN20120305S0063[1]   1046528     31.61     123.8    -398.9     7766.
   cN20120305S0064[1]   1046528     32.35     124.9    -363.1     7651.
   cN20120305S0065[1]   1046528     5.284     97.56    -863.2     7837.
   cN20120305S0066[1]   1046528     5.553     91.67    -606.6     7553.
   cN20120305S0067[1]   1046528     31.93     123.6    -637.3     7494.
***CHECK: Mean counts in QH flats looks normal (350 < mean < 450)
***CHECK: Mean counts in IR flats looks normal (140 < mean < 250)
***CHECK: No deviant QH flats detected
***WARNING: IR flat(s) with deviant counts detected; do you need to reject some data?
***CHECK: No deviant IR flats detected
The lines containing ***CHECK and ***WARNING are also written into the PRODUCTS/Checks_and_Warnings.txt file. As can be seen from the files in the LISTS directory, files 74 - 83 are the quartz halogen flats, files 68 - 73 are the IR flats, and 84 - 85 are the arcs. The script warns that one of the flats has counts that differ from the rest. This is file 68 (mean=106 ADU vs. \(\sim\)180 ADU for the others). That flat looks normal when displayed, so this is probably not a severe issue. These statistics also show that the cleanir script (step 1) did not introduce major changes in the mean counts in the data. The
counts in the standard star (43-50) and galaxy (56-67) are quite stable, which is not necessarily true for data taken in poor conditions. The ABBA nod-to-sky pattern is visible in the counts in the galaxy observation.