H Line Removal (Step=8)
Relevant code
XDpiped.csh HlinesXD.py
Relevant options
1hlines: vega/linefit_auto/linefit_manual/vega_tweak/linefit_tweak/none (linefit_auto)
2        [technique for removing H lines from standard star]
3telluric1_inter: yes/no (no) [run 'telluric' interactively when using vega_tweak option?]
What it does
At this stage, XDGNIRS removes the intrinsic hydrogen absorption lines
in the standard star. The automatic options assume that an early A-type
star was observed, and the code provides semi- or fully-interactive
options as well. The options are:
Vega method: if
hlines=vega, the telluric task is
used to shift and scale a model Vega spectrum (Fig. 11). Whether or not this is done interactively depends on the telluric_inter flag. In either case, the shift and scale values are written to
LISTS/telluric_hlines.txt, so the user can later reproduce what they did manually if desired.
Line fitting method: if
hlines=linefit_auto, the
bplot task is used, together with a list of start and end wavelengths of the H lines, to fit and subtract Lorentz profiles. The line wavelengths are given by the
cur*txtfiles supplied with the code. They were roughly derived by eye, and the user could edit them if desired. To interactively fit and subtract Gaussian, Lorentz, or multiple profiles, set hlines=linefit_manual. This will call splot rather than bplot, so the user can use the “k,” “l,” and “-” keys to fit and subtract a Lorentz profile, for example. As well as being helpful in optimizing the Balmer line removal, this may be useful if the telluric standard wasn’t an A-type star. And this can also be an opportunity to interpolate over obvious spikes, if appropriate.
Example of using the manual line fitting method:
hit “k” at the left-hand side of the line
hit “l” at the right-hand side of the line to fit a Lorentz profile
hit “-” at the right-hand side
hit “-” at the left-hand side to subtract the Lorentz profile
hit “r” to see the spectrum minus the fit
IMPORTANT: hit “i” write the corrected spectrum to a file for later use by
XDGNIRShit “q” to quit and move on to the next order
Fig. 11, which shows the Vega model spectrum used if hlines=vega may help the user distinguish between H lines and telluric absorption lines in their data.
The behavior of splot can be a pain. If you think the code is hung and isn’t doing anything, make sure to click in the grey box at the bottom of the splot window, making sure that the cursor is active, before typing commands there. For example, Splot should not prompt for the name of an output spectrum. If it does, you’ve done something wrong.
Vega_tweak, linefit_tweak: With these options, the Vega or Lorentz fitting algorithm is run first, then the code enters splot so the user can inspect and edit each order. If no changes are necessary, simply hit “q” to quit, and the next order will be shown. To edit the spectra, look at the instructions in the previous bullet.
None: if hlines=none, the code does not attempt to remove any intrinsic lines from the standard star
What to look for
To see whether the H-line residuals are to your satisfaction, look at the
INTERMEDIATE/ftell_nolines* files. You can also wait until the end of the
reduction and inspect the final product. The <target name>_data_sheet.pdf
file in the PRODUCTS directory at the end of the reduction
shows a (rest-frame) Vega spectrum along with the reduced science target
spectrum, and the Vega spectrum is also available in FITS format as
vega_ext.fits in the XDGNIRS GitLab repository. Emission lines at the
location of the absorption lines in the Vega spectrum should be carefully
investigated.
Things to most likely go wrong
This step rarely fails, exactly, but the linefit_tweak or vega_tweak
options are recommended for best results.
Example: NGC 3031
Extension 2/order 4 of the standard star (vstandard_comb[sci,2])
contains several hydrogen absorption lines as well as many telluric
absorption lines Fig. 11. It can be useful to plot an
atmospheric absorption spectrum, represented in Fig. 11 by
the vtarget_comb[sci,2] spectrum, although this is complicated by the
presence of stellar absorption lines in the galaxy), and a model Vega
spectrum (vega_ext2, provided in the XDGNIRS tar file) to figure out
which lines should be removed from the standard telluric spectrum. The
bottom spectrum in Fig. 11, ftell_nolines2, shows the
results of the automated line fitting algorithm.
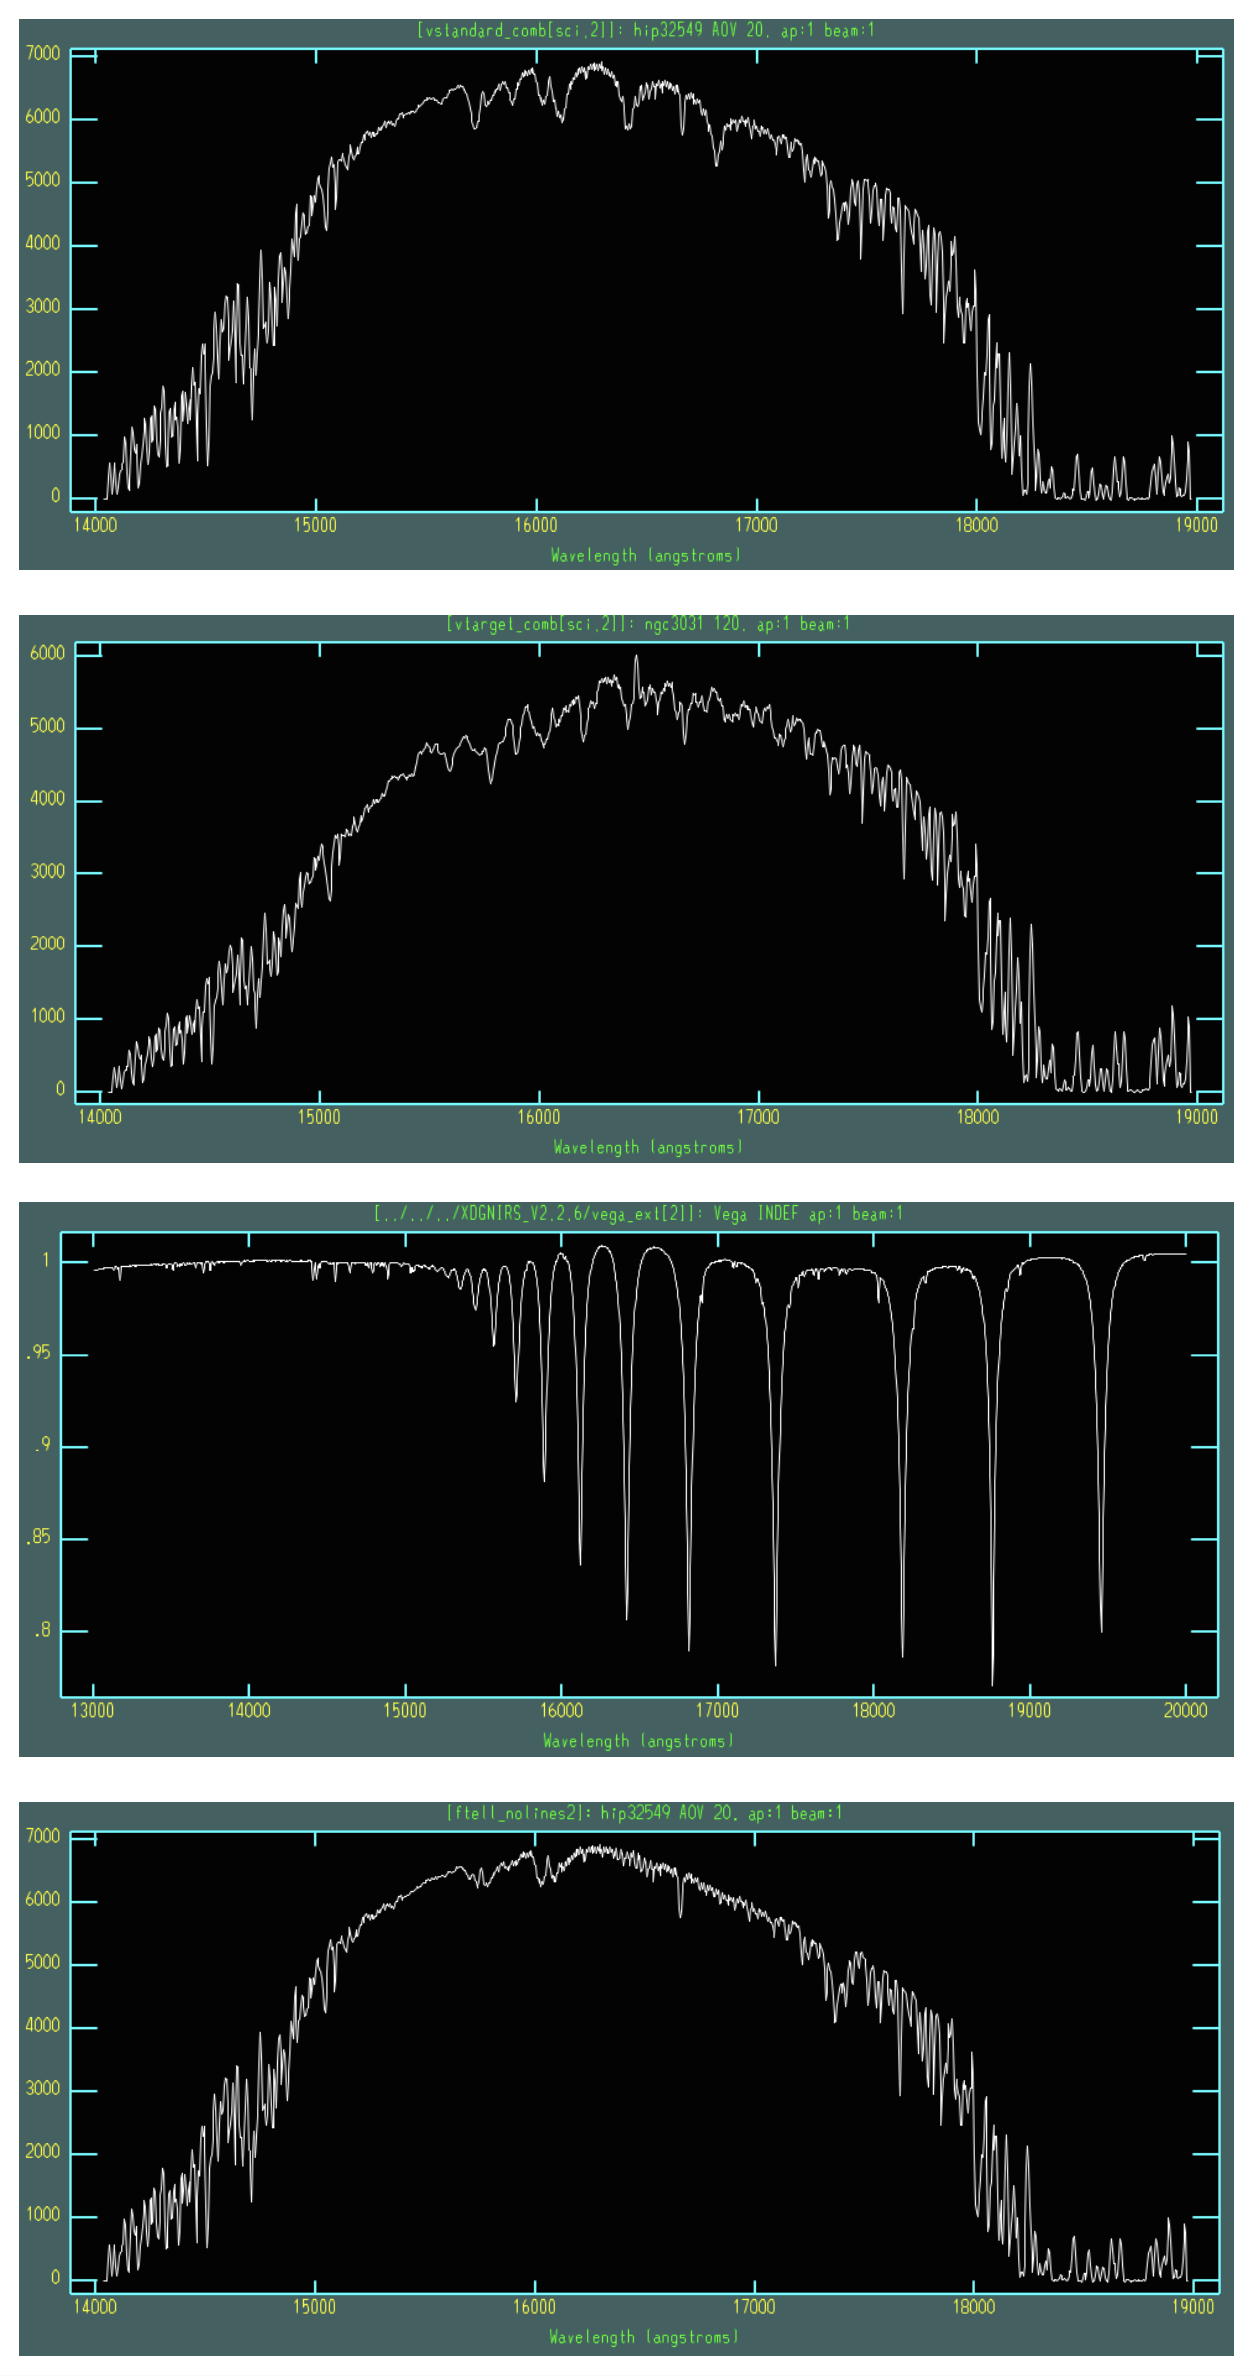
Fig. 11 Standard star spectrum (extension 2/order 4) followed by the science target spectrum, a Vega model spectrum, and the standard star spectrum with the H absorption lines removed.