Science Target Data Sheets (Step=13)
Relevant code
XDpiped.csh GetInfoXD.py WriteDataSheetXD.py
Relevant options
None
What it does
This part of the code makes a pdf file showing the final spectrum and recording some information such as S/N, airmass, etc.
What to look for
Great science results!
Things to most likely go wrong
This step will help the Palomar XD group interpret the reduced
data and may not work well on other data sets. If this step causes
problems, simply run the code with stop=11 and use your own routines
to plot the .txt or .fits files output in that step. The total counts
and FWHM recorded in the datasheet may not be correct for all data
sets.
Example: NGC 3031
Fig. 16 shows the final data sheet created for this galaxy. This spectrum was obtained with no manual intervention (except, arguably, inspecting the radiation event masks as described in Reducing the Science Target and Standard Star Data (Step=4). Various aspects of the reduction could be improved by re-running steps interactively (notably the standard star H line removal). Still, the overall result is a useful quick-look spectrum that could be used for planning future observations, for example.
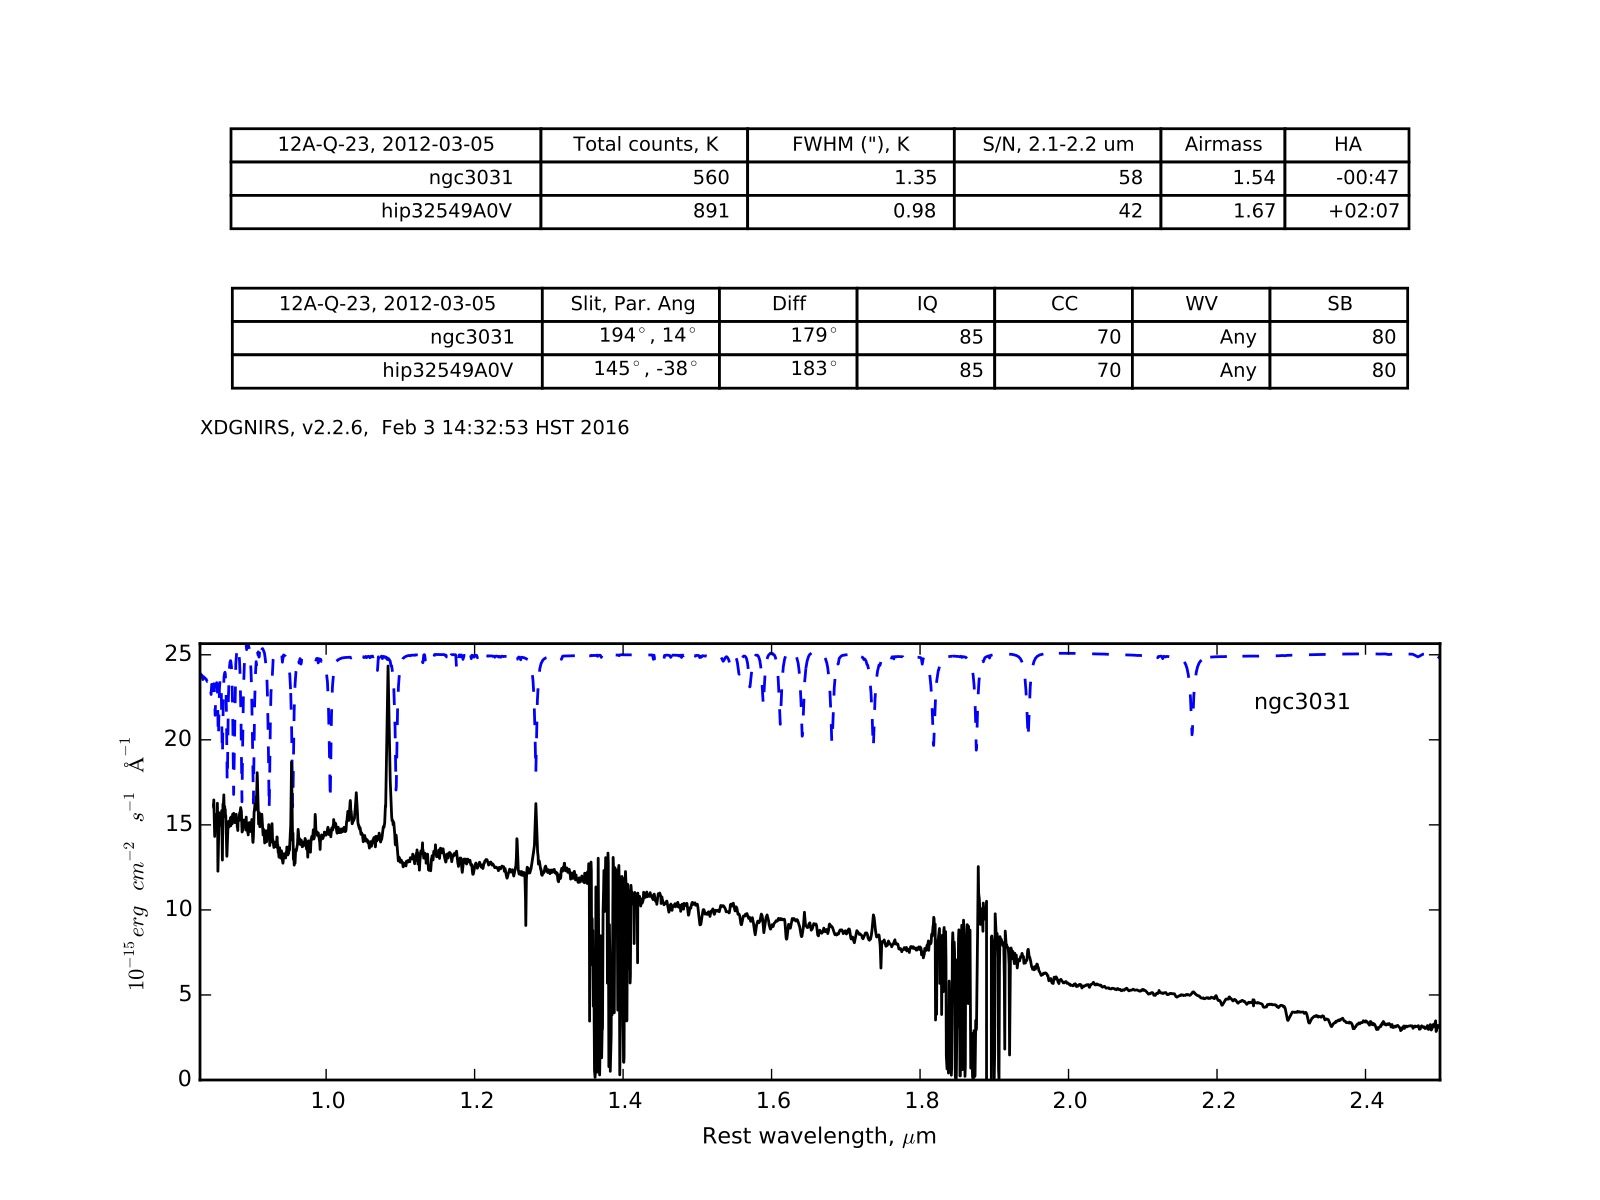
Fig. 16 The “data sheet” generated for NGC 3031. The dashed blue line is a model Vega spectrum, intended to point out the locations where imperfectly removed lines in the standard star could be mistaken for real features. The “messy” regions around 1.4 and 1.8 \(\mu\)m correspond to areas of low atmospheric transmission.